
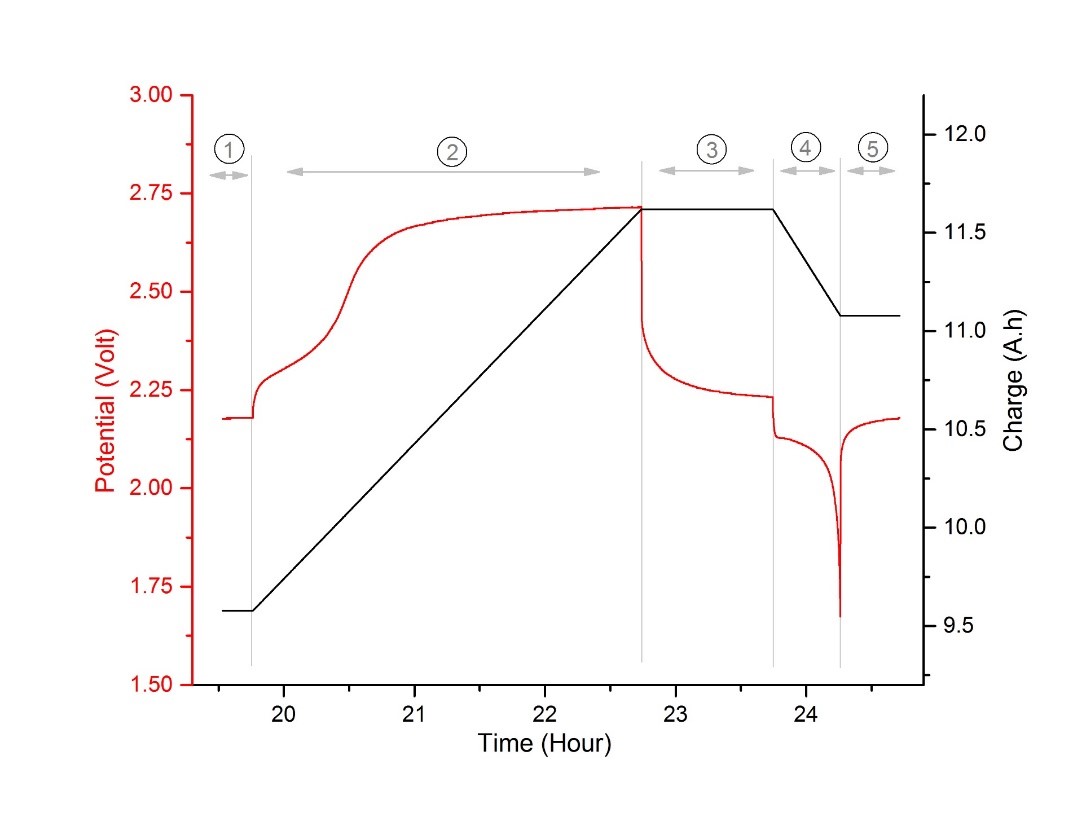

To get familiar with the process of testing lead-acid batteries and the charge-discharge process, one of the charge-discharge diagrams is explained. It was stated that the battery tester device (Battery cycler) in the system measures potential, current and temperature values and sends them to the computer so that the relevant data can be recorded and plotted. In this figure, the data related to the flood potential and input-output coulombs are shown.
The red curve is always the cell potential, the black curve is the stored coulombs, the blue curve is the negative electrode potential, and the green curve is the positive electrode potential. The black curve represents the electric charge, that is, it shows the number of stored coulombs in ampere-hours (A.h). Coulomb is the unit of electric charge and is calculated from the relationship q=i×t, but in practice, the product of the units on the right side of the equation (ampere x hour) is used to express the unit of electric charge, and the word coulomb is not used.
Parts of the load diagram (black curve) that have a positive slope correspond to the charge state and negative slope to the discharge state, the parts that have a zero slope correspond to the resting state, where the input and output currents are zero.
In the figure, region 1 corresponds to rest before charging. In area 2, charging has started and it can be seen that the slope of the charge curve (black curve) has become positive, also in this area, the cell potential is increasing. The shape of the potential curve in region 2 is specific for each type of battery and is a specific characteristic of each battery. It is possible that different types of lead-acid batteries behave differently in this area, or even lead-acid batteries with different lifespans behave differently. In the final part of zone 2, charging is completed and after that, rest begins in zone 3; According to the IEC60095-1 standard, if the battery shows a constant potential during charging for 45 minutes, it is fully charged and after these 45 minutes the charging process must be stopped. It automatically detects and stops charging the battery at the right time, so at the end of the 2nd zone, the charging is automatically stopped and the battery enters the 3rd stage, i.e. rest. It is normal that the battery potential decreases when you start to rest. According to the IEC60095-1 standard, between the charging and discharging process, a rest time between 1 and 4 hours is required, and the duration of one hour has been selected in all functions. After stage 3, which lasts for an hour, the battery enters stage 4, which is discharge. According to the mentioned standard, constant current discharge In is done According to the relevant standard, when the cell potential drops to 1.75 volts (10.5 volts for a 12-volt battery), the discharge must be stopped, which is detected by the battery tester and the discharge process is stopped at the right time. It is natural that the flood potential will decrease with the start of discharge, which shows the shape of this concept. After the discharge is completed, the resting phase begins and the battery enters zone 4. With the start of rest, the potential increases and reaches a constant value after some time. From the product of the discharge time and the discharge current, the available capacity and, accordingly, information about the health status of the battery will be obtained.
By drawing the potential of the positive and negative electrodes separately, the effect of each on the total potential can be checked and the dominant processes in each stage can be obtained. For example, it is possible to understand that the sharp drop in potential at the beginning of the discharge is related to the positive or negative electrode, or which electrode caused the decrease in the cell potential at the end of the discharge and limited the battery capacity. These data can be used in troubleshooting the electrochemical system of the battery. It was mentioned in the previous sections that the battery tester can measure and record the temperature of the environment, bath and electrolyte. The accuracy of temperature data is 0.1 degrees Celsius and its accuracy is about 0.5 degrees. To avoid complexity, the curves related to temperature are not shown in the diagrams and only the data of potential and load (capacitance) are enough.
In this chapter, the specifications of the tested batteries are mentioned as real samples, then the results of the tests will be presented along with the interpretation of the results. All tests were performed on a single cell, in such a way that the 12-volt battery was cut from the top and each cell was examined and tested separately.
 تجهیزات آزمایشگاهی
 تجهیزات آزمایشگاهی تولیدی
 تجهیزات پیشرفته آنالیز
 سایر تجهیزات
 مواد شیمیایی آزمایشگاهی
 دکتر مجللی
 مرک
مرک